
Quick links
- Introduction
- What is Memory Allocation?
- Memory Allocation in Elasticsearch
- Elasticsearch Default Memory Settings
- Why do we need to change the default memory allocation?
- Why are there limits for memory allocation?
- Factors to be considered before changing the default memory allocation
- How to change the Memory Allocation?
- How to check if memory got changed?
- Best Practices for Memory Allocation
- Non-Heap Memory in Java
- Non-Heap Memory in Elasticsearch
- Indexing Buffer
- Field Data Cache
- Summary
Introduction
This guide covers how to change node heap limits and memory allocation in Elasticsearch. This guide will cover manual processes in Elasticsearch.
What is Memory Allocation?
Memory allocation entails allocating either physical or logical memory to a process or application for its execution. When programs are executed, they store data and instructions in memory, so that the CPU can process them. This memory won’t be released until the process completes or it sits idle.
Memory allocation can be done by static allocation or dynamic allocation. During static allocation, memory is allocated at compile time and remains fixed throughout the program’s execution. In contrast, dynamic allocation involves allocating memory at runtime, as needed by the program.
Memory Allocation in Elasticsearch
In Elasticsearch, heap memory allocation is a process that helps optimize performance and prevent out-of-memory errors by allocating memory to various components of the Elasticsearch system.
Elasticsearch runs on a Java Virtual Machine (JVM) and uses a portion of the system’s memory to store data and perform various tasks, such as indexing and searching.
JVM uses a combination of heap and non-heap memory to manage memory allocation. The heap is the portion of memory used to store objects created by the application, while non-heap memory is used to store metadata and other information.
To optimize memory allocation in Elasticsearch, users must configure the JVM heap and non-heap size appropriately based on available system resources, stored data volume, and expected search or index load.
Elasticsearch Default Memory Settings
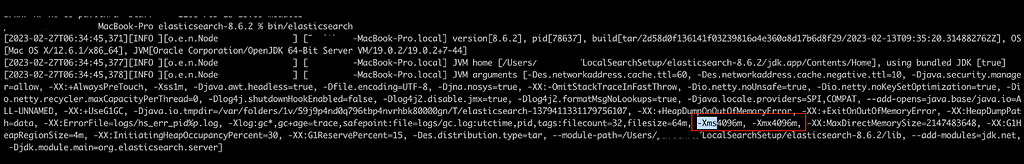
By default, heap memory is allocated based on the node’s role and total available memory. Following the default JVM settings is recommended, however, in some cases, users may need to change these, as we will see in the next section.
Once the node is up, users can check the memory settings in the elasticsearch logs. As per the below image, nodes are configured with a 4GB heap (i.e. 4096m).
Why Does the Default Memory Allocation Need to Be Changed?
When experiencing issues, such as slow performance, degraded search functionality, or out-of-memory (OOM) errors in Elasticsearch, it’s important to analyze and optimize any inefficient or costly queries. By optimizing the application and improving query performance, it’s possible to achieve significant reductions in memory usage and better overall performance, without the need for costly hardware upgrades. If issues continue, even after optimization, then it may be necessary to consider changing memory allocation.
Out-of-memory errors occur when an Elasticsearch cluster runs out of the available memory it needs to perform activities, which can cause the node to crash or become unresponsive. This can happen if the data being indexed or searched is too large, or if the cluster is under heavy load. If this happens, adjusting the memory allocation settings can help provide more memory to the Elasticsearch cluster and avoid out-of-memory errors.
Similarly, slow performance or reduced search functionality could indicate that the memory allocation settings need to be modified. If the system exhausts its memory, it might begin to swap data to disk, which can lead to a substantial reduction in performance. This happens because accessing data on disk is much slower than accessing it in memory, slowing down read and write operations. For example, if search queries are taking an excessive amount of time to execute, increasing the memory allocation to the node may be necessary to enhance performance and handle the extra workload.
Why Are There Limits for Memory Allocation?
Elasticsearch has restrictions on memory allocation to prevent the system from running out of memory, which can cause performance issues or system crashes. If Elasticsearch were to use all available memory on a system, it could lead to other applications or processes being starved of resources, which can degrade performance or cause system failures. But during production, it is recommended to run only Elasticsearch in a node.
By setting limits on memory allocation, Elasticsearch can ensure that it uses memory efficiently and effectively, without exceeding the available system resources. Additionally, by setting limits on specific components, such as the indexing buffer and field data cache, Elasticsearch can prevent individual components from consuming too much memory and causing performance issues.
Compressed object pointers also help Elasticsearch maintain efficient heap memory usage by reducing the memory overhead associated with object references, allowing more data and Elasticsearch-related structures to be stored within the available heap memory.
Here’s how compressed object pointers contribute to better heap memory management in Elasticsearch:
- Reduced Memory Overhead: Compressed object pointers reduce the size of object references, which are typically 8 bytes (64 bits) in a 64-bit JVM. By using compressed pointers, Elasticsearch can represent object references with fewer bits, often 32 bits or fewer, depending on the specific JVM and configuration. This reduction in the size leads to a reduction in memory overhead.
- Increased Data Storage: The reduced memory overhead means that more space is available in the heap memory for storing actual data, such as documents, indexes, and other Elasticsearch-related structures. In a system where memory efficiency is crucial, every saved byte on references means more space for data storage.
It’s important to note that memory allocation limits are not random and are based on factors like the size of the dataset being indexed, the number of nodes in the cluster, and the complexity of the search queries being performed.
As mentioned earlier, optimizing the query and implementing caching improves performance and saves additional hardware costs. If this doesn’t work, try fine-tuning the memory allocation settings for better performance.
Factors to Consider Before Changing the Default Memory Allocation
Before changing the default memory allocation settings in Elasticsearch, it is important to consider the following:
- Available System Resources: The amount of memory that can be allocated to Elasticsearch depends on available system resources. Ensure that the system has enough available memory to accommodate the increased memory allocation without impacting other applications or services running on the system.
- Workload: The amount of memory required by Elasticsearch depends on the size of the dataset being indexed, the number of nodes in the cluster, and the complexity of the search queries being performed.
- Performance Metrics: It’s important to monitor performance metrics such as CPU usage, disk I/O, and memory usage to identify trends and potential issues. If performance issues are observed, consider adjusting the memory allocation settings.
- Testing: Elasticsearch may be part of a larger application stack that depends on other resources or components. So, before changing memory allocation settings, it’s important to test the changes in a non-production environment to ensure that they do not negatively impact system performance or stability.
These points can help users make informed decisions about when and how to adjust memory allocation settings in Elasticsearch to optimize performance and stability.
How to Change Heap Memory Allocation
1. Using JVM Options File
The JVM options directory allows users to edit JVM configs. This is the preferred way, especially for production clusters.
Follow the steps below to change JVM settings:
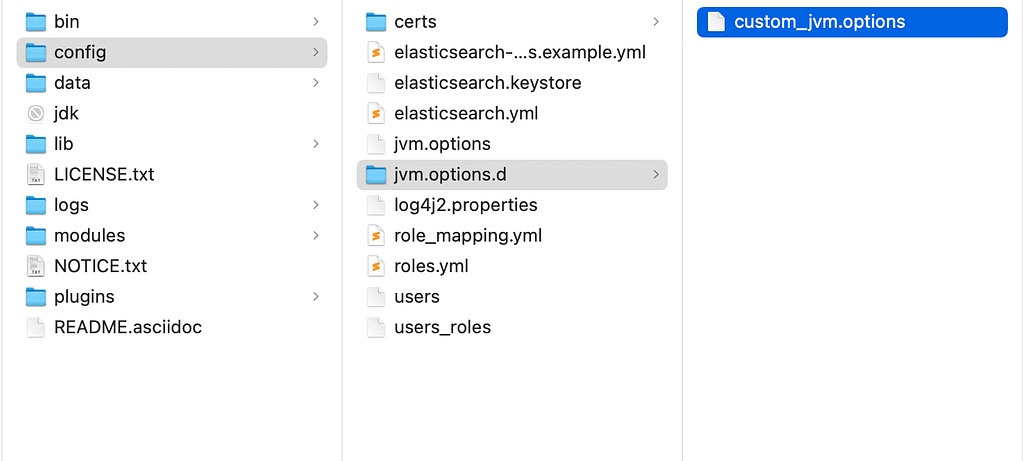
- In the Elasticsearch directory, navigate to the config/jvm.options.d directory. Note that depending on the distribution, the folder might be different
- Enter JVM arguments in the file, initial and max values should be the same to avoid resizing during runtime.
- Sample contents inside the file:
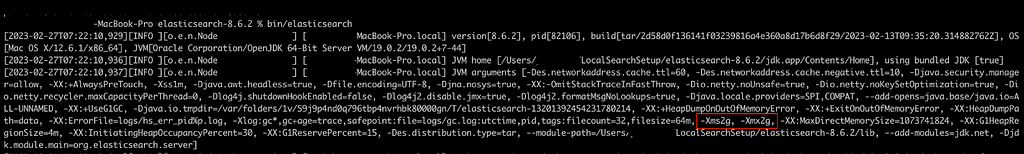
-Xms2g -Xmx2g
- Here, Xms denotes the initial heap memory allocated during startup and Xmx denotes the maximum heap memory the JVM can utilize.
- If needed, users can add comments to the file preceded with “#” for better understanding. Lines that are commented out will not be considered.
2. Using Environment Variables
Environment variables can be used to change JVM settings, but this is recommended for dev or testing purposes only.
ES_JAVA_OPTS is the key that has to be updated
ES_JAVA_OPTS="-Xms2g -Xmx2g" ./bin/elasticsearch
How to Check if Memory Has Changed
Changes will be effective after restarting the node. Users can check the JVM arguments in Elasticsearch logs, these will show updated values.
That’s it! The node’s heap memory allocation has been changed.
Heap Memory Allocation Best Practices
Here are some best practices for heap memory allocation in Elasticsearch:
- Determine the right amount of heap memory: As mentioned earlier, before allocating memory to Elasticsearch, it’s important to determine the right amount of heap memory needed to support the workload. Consider the size of the dataset being indexed, the number of nodes in the cluster, and the complexity of the search queries being performed. As a general rule, allocate no more than 50% of the available system memory to the JVM heap and no more than 30.5GB.
- Monitor memory usage: Regularly monitor heap memory usage to ensure that memory allocation settings are optimized. Use the Elasticsearch monitoring API or third-party monitoring tools to track memory usage, identify trends, and potential issues.
- Configure multiple nodes: Using multiple nodes in an Elasticsearch cluster can distribute memory usage across multiple servers, preventing memory contention and improving system performance. It can also improve the availability and fault tolerance of the cluster.
- Adjust memory allocation settings: Configure specific memory allocation settings to prevent individual components from consuming too much memory. For example, set limits on the indexing buffer and field data cache (we will review this in detail in the next section) to prevent excessive memory usage by any specific component.
- Review documentation: Review these to ensure that memory allocation settings are configured correctly and in line with recommended best practices.
- https://www.elastic.co/guide/en/elasticsearch/reference/current/advanced-configuration.html#set-jvm-heap-size
- https://www.elastic.co/guide/en/elasticsearch/reference/current/query-cache.html
- https://www.elastic.co/guide/en/elasticsearch/reference/current/shard-request-cache.html
- https://www.elastic.co/guide/en/elasticsearch/reference/current/circuit-breaker.html
Non-Heap Memory in Java
In Java, the non-heap memory area, also known as the “permanent generation” or “metaspace,” depending on the version of Java being used, is a region of memory used for storing class definitions and metadata about the Java Virtual Machine (JVM) internals.
The size of the non-heap memory area is determined by JVM configuration parameters and can vary based on specific application requirements. The memory usage in the non-heap memory area is generally less than the heap memory area, since it is mainly used for JVM internals, and its size is typically much smaller.
Non-Heap Memory in Elasticsearch
Non-heap memory in Elasticsearch is the amount of memory allocated to the JVM for object storage that is not part of the heap. This includes objects like the JVM metaspace, thread stacks, and interned strings.
Why and When to Change the Non-Heap Memory
Changing the non-heap memory settings in Elasticsearch might be necessary in a few scenarios to optimize the performance and stability of the cluster. Keep in mind that is generally not advised to mess with no-heap memory in Elasticsearch.
- Memory Requirements: If you notice frequent out-of-memory errors or performance degradation, adjusting the non-heap memory configuration can help allocate more memory to critical areas like the Metaspace or thread stacks.
- Metaspace Management: Metaspace is a non-heap memory area used by the JVM to store class metadata. If users have a large number of classes or dynamically loaded classes in their Elasticsearch environment, they may need to increase the Metaspace size to prevent errors caused by class metadata exceeding the default capacity.
- Direct Memory Allocation: If a cluster heavily relies on direct memory for I/O operations or other native interactions, users might need to adjust the maximum direct memory allocation to accommodate specific workload requirements.
- Custom Plugins or Integrations: If custom plugins or integrations with Elasticsearch use non-heap memory, such as native libraries or external components, it’s a good idea to fine-tune the non-heap memory settings to ensure they have sufficient memory for operations.
Alternate Solutions to Avoid Changing the Non-Heap Memory
As mentioned in the previous section, increasing memory is not the only solution for performance degradation or out-of-memory (OOM) errors. Thoroughly analyzing the root causes of these issues and exploring other potential optimizations before considering hardware upgrades is essential. Here are a few steps to consider before resorting to hardware upgrades:
- Cluster and Shard Configuration: Evaluate cluster and shard configurations to ensure these are optimal for your workload. Please refer here for further details.
- Query Optimization: Identify and optimize inefficient or resource-intensive queries. Analyze query execution plans, identify costly operations, and consider rewriting or restructuring queries to improve performance. Please refer here for further details.
- Caching Strategies: Enable and configure appropriate caches. Proper caching strategies can significantly improve query performance and reduce memory pressure.
- Hardware Resource Analysis: Perform a thorough analysis of hardware resources, including CPU, disk I/O, and network. Bottlenecks in these areas can impact overall system performance.
How to Change Non-Heap Memory
1. To change thread stacks: Open custom_jvm options file from /config/jvm.options.d directory and add the following settings:
- To set the thread stack size to 256 kilobytes (the default), add the below config:
-Xss256k
- To set a larger stack size, specify it in megabytes, like this:
-Xss1m
2. To change metaspace: edit the same custom_jvm options file and add any one of the settings:
- -XX:MaxMetaspaceSize: This option sets the maximum size for the Metaspace. Users can specify the maximum amount of memory it can use.
- -XX:MetaspaceSize: This option sets the initial size of the Metaspace. This is the amount of memory reserved at the start.
-XX:MaxMetaspaceSize=512m
-XX:MetaspaceSize=64m
3. To change direct memory allocation: edit the same custom_jvm options file and add any one of the settings:
- -XX:MaxDirectMemorySize: Specifies the maximum size for direct memory allocation. Users can set it to a fixed value (e.g., “512m” for 512 megabytes).
- -XX:MaxDirectMemoryPercentage: Instead of specifying a fixed size, users can set the percentage of the maximum heap size that can be used for direct memory allocation.
-XX:MaxDirectMemorySize=512m
# Or
-XX:MaxDirectMemoryPercentage=75
Indexing Buffer
In Elasticsearch, the indexing buffer size controls the amount of memory used for indexing operations. The default value for the indexing buffer is 10% of the available heap memory.
Why and When to Change the Indexing Buffer Size
The indexing buffer size should be set based on Elasticsearch’s specific workload requirements. It’s important to monitor memory usage and performance metrics to determine the optimal indexing buffer size.
- When there’s a large volume of data to index, increasing the indexing buffer size can help improve indexing performance by allowing Elasticsearch to process more data in memory before writing to disk.
- If out-of-memory errors occur during indexing operations, reducing the indexing buffer size can help free up memory and prevent further errors.
- When indexing a large number of smaller documents, reducing the indexing buffer size can help reduce the memory footprint of each indexing operation.
Alternate Solutions to Avoid Increasing Indexing Buffer Size
There are several alternative solutions to consider before changing the indexing buffer size.
- Use Bulk APIs: Instead of changing the indexing buffer size, optimize the indexing process by using the Bulk API for bulk indexing. The Bulk API allows users to send multiple indexing requests in a single API call, improving indexing efficiency and reducing memory usage.
- Optimize Indexing Pipeline: Optimize the indexing pipeline to reduce the memory footprint. This includes techniques, such as filtering out unnecessary fields, reducing the size of indexed data, or improving the efficiency of data transformations during indexing.
- Shard Configuration: Adjusting the number and size of the shards can impact indexing performance and memory usage. By carefully configuring the number of primary and replica shards, users can distribute the indexing load and reduce the memory requirements per shard.
How to Change Indexing Buffer Size
Indexing buffer size settings are static and need to be configured on all cluster nodes. On each node, follow the steps below to change the buffer size:
1. Open elasticsearch.yml from /elasticsearch/config/ directory and add the following settings. Note that depending on the distribution, the folder names vary.
a) indices.memory.index_buffer_size – specifies the maximum amount of memory that can be used by the indexing buffer. Configure the new limit in either percentage or byte size.
When a percentage value is specified, Elasticsearch calculates the buffer size dynamically based on the heap memory allocated to Elasticsearch within the JVM. The calculation takes into account the current heap memory allocation and adjusts the buffer size accordingly.
indices.memory.index_buffer_size: 20%
The direct value indicates the static heap memory allocated for indexing. In the example below, the indexing buffer size is set to 512 megabytes.
indices.memory.index_buffer_size: 512mb
b) indices.memory.min_index_buffer_size – this setting allows users to specify the minimum size for the indexing buffer, which defaults to 48mb.
indices.memory.min_index_buffer_size: 64mb
c) indices.memory.max_index_buffer_size – this setting allows users to specify the maximum size for the indexing buffer, its default is unbounded.
indices.memory.max_index_buffer_size: 512mb
2. Once the changes are made, save the file and restart the node.
Field Data Cache
The field data cache in Elasticsearch is a memory cache that stores the field values of indexed documents and global ordinals. Global ordinals are data structures that are precomputed and shared across all segments of an index in Lucene, and represent a unique identifier for each distinct term in a text field. These ordinals are used to efficiently map terms to numeric values, which can significantly speed up operations involving sorting and aggregating documents based on text fields. To enable global ordinals for a field, specify this “global_ordinals” option in the field mapping.
When a text field is marked as “fielddata=true” in the mapping configuration, Elasticsearch loads the field values into the field data cache, allowing for quick access to the values. Similarly, global ordinals are unique terms computed per shard. Elasticsearch computes this list during index time and it’s refreshed when the index refreshes as per refresh interval.
However, it’s important to note that the field data cache can consume a significant amount of memory, especially for large-sized text fields, since every token ends up in the cache. This can impact the cluster’s overall memory usage and performance.
Why and When to Change the Field Data Cache Size
Changing the field data cache size in Elasticsearch may be necessary in certain scenarios to manage memory usage and improve performance. Here are some situations where users might want to consider changing the field data cache size:
- Low Memory Usage: If an Elasticsearch cluster has ample available memory and the field data cache is not being fully utilized, increasing the cache size can help take advantage of the available memory and improve performance by caching more field values.
- Aggregations and Sorting: If aggregations or sorting on large fields are performed frequently, increasing the field data cache size can help improve performance by keeping more field data in memory.
- Query Performance: In some cases, increasing the field data cache size can speed up query performance. When queries involve filtering or matching against indexed fields, a larger field data cache can reduce the need for disk I/O operations by keeping more frequently accessed field data in memory.
Alternate Solutions to Avoid Increasing Field Data Cache Size
Here are a few alternate approaches to consider before changing the field data cache:
- Limit the text fields marked as “fielddata=true.”
- Use doc values instead of field data – Doc values are a columnar storage format in Elasticsearch that provide a memory-efficient way to access field values. They offer similar functionality to field data but use a different underlying on-disk data structure. By enabling doc values, users can reduce memory usage.
- Adjust the size of indexed fields – If a user has control over the indexed fields, they can consider adjusting their size. For example, if a field has large text content, users can analyze and index only the necessary parts, or limit the length of the indexed content. This can help reduce the memory usage associated with storing and accessing the field data.
- Optimize queries and aggregations.
How to Change Field Data Cache Size
Field data cache size settings are static and need to be configured in all cluster nodes. On each node, follow the steps below to change the cache size:
- Open elasticsearch.yml from the /elasticsearch/config/ directory and add the following settings:
- indices.fielddata.cache.size: This setting allows users to specify the maximum size of the field data cache across all indices. It can be configured with values like “10%” or “500mb” to limit memory usage. The value should be set lower than the field data circuit breaker.
- The field data circuit breaker is the cache limit, if the cache exceeds the configured memory limit, the circuit breaker will stop the process and throw an error. To avoid this error, Elasticsearch evicts the least-recently updated entries from the cache. This eviction process ensures that the cache remains within the defined size limit.
- indices.fielddata.cache.size: This setting allows users to specify the maximum size of the field data cache across all indices. It can be configured with values like “10%” or “500mb” to limit memory usage. The value should be set lower than the field data circuit breaker.
- Once changes are made, save the file and restart the node.
Summary
Memory allocation is a critical aspect of programming. Efficient memory management can significantly impact the performance of an application, especially with Elasticsearch. So, it is better to be cautious while assigning memory to the application. By closely monitoring and fine-tuning heap memory allocation settings, Elasticsearch can deliver peak performance without compromising its stability and dependability.