
Quick links
Introduction
In this article, we will compare Logstash, the flagship ingestion tool of the ELK (Elasticsearch Logstash Kibana) stack, and Data Prepper, OpenSearch’s ingestion tool response. To give you some context, Logstash was added to ELK in 2012, and Data Prepper was launched in 2021.
This evaluation compares the following aspects of each tool:
- High-level diagram
- Overview
- Components
- Usage
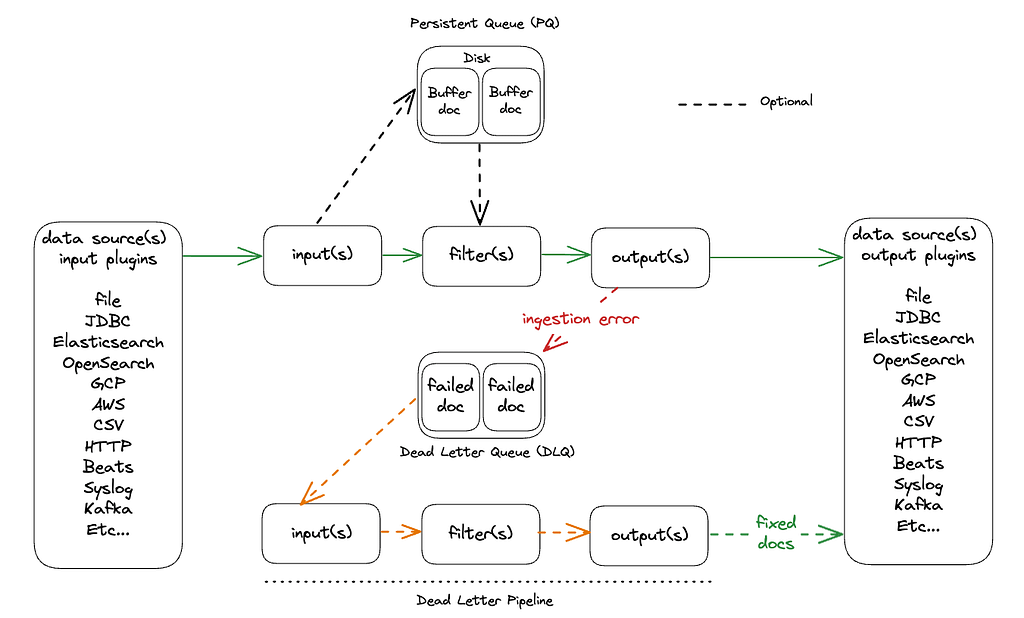
High-level diagram
Logstash
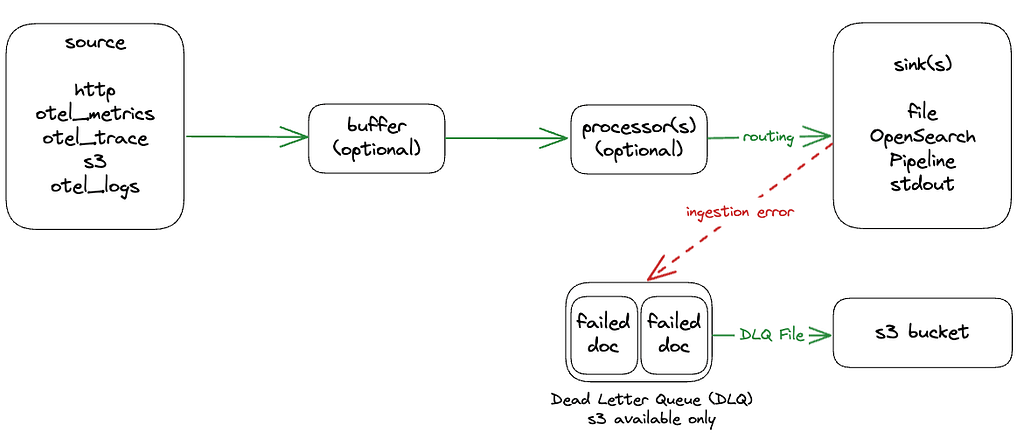
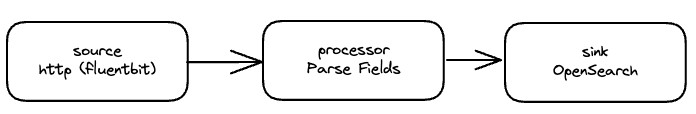
Data Prepper
Overview
Logstash
“Logstash is a free and open server-side data processing pipeline that ingests data from a multitude of sources, transforms it, and then sends it to your favorite ‘stash.’”
https://www.elastic.co/logstash
Logstash is a battle-tested ingestion framework that allows you to build a large number of pipeline patterns. It does that by allowing many inputs, filters, and outputs, with the option of chaining the output of one pipeline into another.
Logstash has a large catalog of input and output plugins that allows you to read from and write to a multitude of data sources, from HTTP/TCP/CSV to GCS/AWS S3/Elasticsearch.
From a durability perspective, Logstash offers persistent queuing to temporarily buffer requests that cannot be sent, and dead letter queuing to process documents that failed on ingestion.
Data Prepper
“Data Prepper is a server-side data collector capable of filtering, enriching, transforming, normalizing, and aggregating data for downstream analytics and visualization.”
https://github.com/opensearch-project/data-prepper
Data Prepper emerged as the official ingestion tool for OpenSearch almost ten years after the launch of Logstash. It uses a similar concept: source, buffer, processor(s), and sink(s) that allow you to read from one source and write to many sinks of data.
Data Prepper’s catalog of sources/processors/buffers is more limited, but there are two interesting things to note. First, Data Prepper supports running Logstash configuration files (although the configurations you can run appear to be so restricted that this is unlikely to be workable except in extremely limited circumstances). Second, it offers integration with OpenTelemetry for logs and traces, which is gaining popularity.
Another interesting aspect of Data Prepper is that it offers OpenSearch distributed tracing support leveraging the OpenTelemetry collectors, which is something Logstash does not provide as it is more generic.
Components
Logstash
Input plugins
The input plugin is the data entry point that enables Logstash to ingest documents from a variety of sources.
The following list contains all of the available input plugins for Logstash:
| azure_event_hubs beats cloudwatch couchdb_changes dead_letter_queue elastic_agent elastic_serverless_forwarder elasticsearch exec file ganglia gelf generator github google_cloud_storage google_pubsub graphite heartbeat http http_poller imap irc java_generator java_stdin jdbc jms jmx kafka | kinesis log4j lumberjack meetup pipe puppet_facter rabbitmq redis relp rss s3 s3-sns-sqs salesforce snmp snmptrap sqlite sqs stdin stomp syslog tcp udp unix varnishlog websocket wmi xmpp |
Each plugin will have its own set of settings in addition to the common settings, which include add_field, codec, enable_metric, id, tags, and type. Some plugins come as standard with Logstash, others need to be installed manually.
Filter plugins
Filter plugins are optional and enable Logstash to do data processing, from simple things like removing a field to allowing custom ruby code. You can also do enrichment based on external HTTP addresses, SQL databases, and even Elasticsearch indices. A Grok filter is also included to extract fields from log lines.
The Logstash filter plugins are listed below:
| age aggregate alter bytes cidr cipher clone csv date de_dot dissect dns drop elapsed elasticsearch environment extractnumbers fingerprint geoip grok http i18n java_uuid jdbc_static | jdbc_streaming json json_encode kv memcached metricize metrics mutate prune range ruby sleep split syslog_pri threats_classifier throttle tld translate truncate urldecode useragent uuid wurfl_device_detection xml |
Output plugins
The output plugin is the end of the pipeline. One, or many, must be defined, and you can choose from a list similar to but not the same as the input ones.
The output plugins are listed below:
| boundary circonus cloudwatch csv datadog datadog_metrics dynatrace elastic_app_search elastic_workplace_search elasticsearch exec file ganglia gelf google_bigquery google_cloud_storage google_pubsub graphite graphtastic http influxdb irc java_stdout juggernaut kafka librato loggly lumberjack | metriccatcher mongodb nagios nagios_nsca opentsdb pagerduty pipe rabbitmq redis redmine riak riemann s3 sink sns solr_http sqs statsd stdout stomp syslog tcp timber udp webhdfs websocket xmpp zabbix |
Persistent queue (PQ)
A persistent queue allows Logstash to protect against data loss, storing events on disk so they can be recovered after a restart. It can also absorb message bursts that the output can not handle.
This feature is disabled by default, which means events are handled in memory. You have to take into consideration that enabling PQ will reduce the ingestion speed.
Dead letter queue (DLQ)
A dead letter queue gives a second chance to the documents that failed on ingestion with codes 400 or 404. You can set a specific pipeline (input-filter-output) for these documents to fix them and then try to ingest them again. This is very convenient because you can fix errors in the documents without losing the data.
This feature is disabled by default and only supported by the Elasticsearch output.
Data Prepper
Source
The source defines where the data is coming from. You must define one.
The available sources on Data Prepper are as follows:
- http_source
- otel_metrics_source
- otel_trace_source source
- s3 source
- otel_logs_source
Clearly, Data Prepper has significantly fewer available sources compared to Logstash. Logstash users are likely to miss the Kafka, JDBC, and Syslog input sources. The lack of Filebeat input also means you cannot use the Elasticsearch standard log shipper. However, alternative log shippers, such as Fluentd, can be used with s3 as a buffer or directly to the http_source input.
Buffer
A buffer will cumulate events and can be in memory or on disk if you decide to create a custom buffer. Right now, there is only one built-in alternative, which is an in-memory bounded blocking buffer. Data Prepper users can also consume logs via an s3 bucket, which gives a practical workaround to avoid the need for buffering inside Data Prepper.
Processor
Processors fulfill the same purpose as Logstash filters and provide the ability to filter, transform, and enrich event data.
Comparative table of available filters/processors
The filters in the left-hand column in black originally appeared in Logstash. The processors shown in red were originally developed in Data Prepper.
| Filter/Processor | Logstash | Data Prepper |
|---|---|---|
| age | x | |
| aggregate | x | x |
| anomaly_detector | x | |
| alter | x | |
| bytes | x | |
| cidr | x | |
| cypher | x | |
| clone | x | |
| csv | x | x |
| date | x | x |
| de_dot | x | |
| detect | x | |
| dissect | x | |
| dns | x | |
| drop | x | drop_events |
| elapsed | x | |
| elasticsearch | x | |
| environment | x | |
| fingerprint | x | |
| geoip | x | |
| grok | x | x |
| http | x | |
| i18n | x | |
| java_uuid | x | |
| jdbc_static | x | |
| jdbc_streaming | x | |
| json | x | parse_json |
| json_encode | x | |
| kv | x | key_value |
| list_to_map | x | |
| memcached | x | |
| metricize | x | |
| metrics | x | |
| mutate | x | add_entries,convert_entry_type,copy_values,delete_ entries,substitute_string,split_string, uppercase_string,lowercase_string,trim_string |
| otel_metrics | x | |
| otel_trace | x | |
| otel_trace_group | x | |
| prune | x | |
| range | x | |
| routes | x | |
| ruby | x | |
| service_map | x | |
| sleep | x | |
| split | x | |
| syslog_pri | x | |
| threats_classifier | x | |
| throttle | x | |
| tld | x | |
| trace_peer_forwarder | x | |
| translate | x | |
| truncate | x | |
| url_decode | x | |
| user_agent | x | |
| uuid | x | |
| wurfl_device_detection | x | |
| xml | x |
In general, we can see that Logstash is stronger in data enrichment and lookup filters, but Data Prepper does have some interesting OpenTelemetry and anomaly detection processors.
Diehard Logstash users will miss the translate and JDBC enrichment filters, and especially the possibility to write bespoke code using the ruby filter, none of which are currently available in Data Prepper.
However, we can see how Data Prepper is close to OpenTelemetry, providing specific processors like otel_* to enrich documents following the OTel standards. Data Prepper is also focused on observability, providing an anomaly_dector processor which uses machine learning algorithms to detect anomalies in the data.
Another useful tool is the “routes” processor, which can be used to define the conditions that determine which sink the events must use (see below for more information on sinks).
Sink
A sink defines where Data Prepper should write the data. Here you can use the routes you defined in the processor step. It is possible to define more than one sink.
The available sinks are as follows:
- file sink
- OpenSearch sink
- pipeline sink
- stdout sink
Dead letter queue
The dead letter queue in Data Prepper allows you to save failed documents into an s3 bucket in a special format as a JSON array:
dlq-v${version}-${pipelineName}-${pluginId}-${timestampIso8601}-${uniqueId}
Currently, s3 is the only supported source.
Usage
To compare the usage of Logstash and Data Prepper, let’s take a common example of a task, reading from a custom log file, and then look at what happens when we send the data to Elasticsearch/OpenSearch depending on which tool we are using.
[2023-05-15 08:22:35][INFO][192.168.1.10] – User ‘gustavo llermaly’ successfully logged in.
[2023-05-15 08:23:05][INFO][192.168.1.10] – User ‘gustavo llermaly’ visited ‘/my-account’.
[2023-05-15 08:24:30][ERROR][192.168.1.10] – System crashed while user ‘gustavo llermaly’ was active.
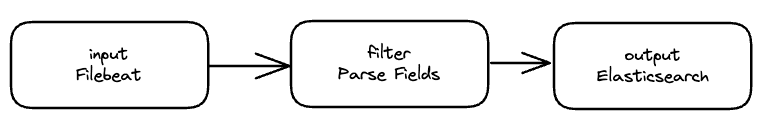
Logstash
For this use case, a common pattern is to install Filebeat on the host, read the log file, and then send it to Logstash. This allows us to centralize Logstash across many machines using Filebeat, which is a lightweight data shipper. Logstash also includes a “file” input that you can use to read the file directly. But here we will use Filebeat to keep the examples as similar as possible.
First, you must install Filebeat on the host machine and use the following yml file:
filebeat.inputs:
– type: filestream
enabled: true
paths:
– /var/log/app_logs/test.log
output.logstash:
hosts: [“logstash:5044”]
In this example, Logstash and Filebeat are installed on the same machine.
With this configuration, the host machine will send the file with Filebeat to the Logstash host.
Logstash uses a custom file type for the configuration, which looks like this:
input {
    beats {
        port => 5044
    }
}

filter {
    grok {
        match => {
            "message" => "\[%{TIMESTAMP_ISO8601:timestamp}\]\[%{LOGLEVEL:loglevel}\]\[%{IPV4:ip}\] - %{GREEDYDATA:message}"
        }
    }

    date {
        match => [ "timestamp", "YYYY-MM-dd HH:mm:ss" ]
    }
}

output {
    elasticsearch {
        hosts => ["https://es01:9200"]
        index => "logstash-vs-dataprepper"
        user => "elastic"
        password => "changeme"
        ssl_certificate_verification => "false"
    }
    stdout {
        codec => rubydebug
    }
}
This will parse each line into fields and send them to Elasticsearch.
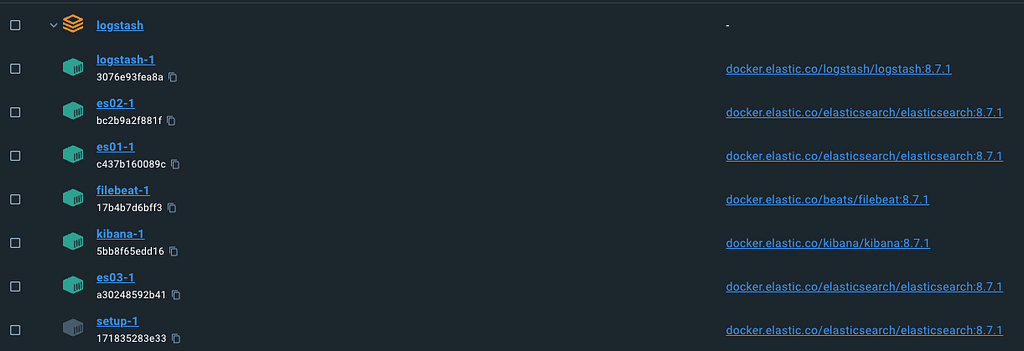
Note – this example uses three nodes because it is based on the official docker-compose Elastic file.
You can find a docker-compose working example <<here>>. Unzip the file and run:
docker-compose up
Then go to https://localhost:5601 (user: elastic, password: changeme) to see the logs in Kibana:
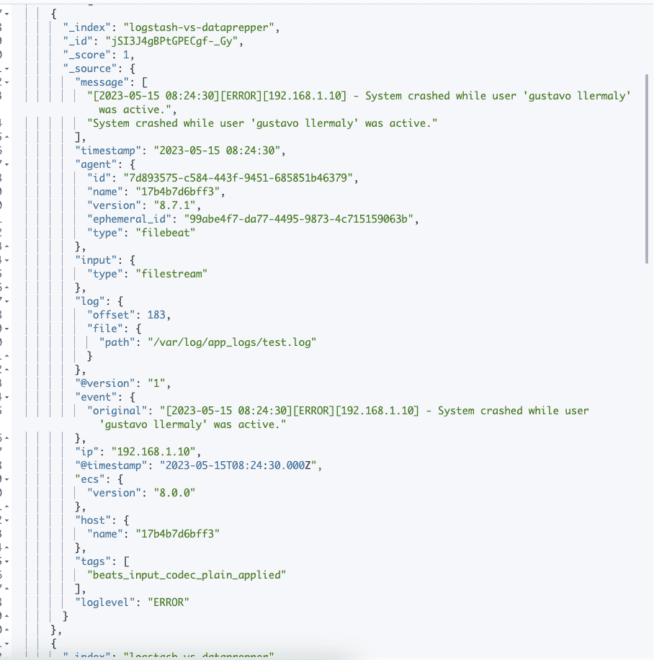
Data Prepper
The Data Prepper flow is similar to that described above for Logstash. However, instead of using Filebeat as the data shipper, we will use FluentBit, which will send the logs to Data Prepper using the HTTP source.
FluentBit configuration
[INPUT]
  name                  tail
  refresh_interval      5
  path                  /var/log/test.log
  read_from_head        true

[OUTPUT]
  Name http
  Match *
  Host data-prepper
  Port 2021
  URI /log/ingest
  Format json
  Retry_Limit False
Note – port 2021 is the default one for the HTTP source. We also set Retry_Limit: false for FluentBit to wait for Data Prepper to be ready.
Next, we will configure the Data Prepper file:
log-pipeline:
  source:
    http:
  processor:
    - grok:
        match:
          log:
            [
              "\\[%{TIMESTAMP_ISO8601:timestamp}\\]\\[%{LOGLEVEL:loglevel}\\]\\[%{IPV4:ip}\\] - %{GREEDYDATA:message}",
            ]
  sink:
    - opensearch:
        hosts: ["https://opensearch:9200"]
        username: "admin"
        password: "admin"
        index: logstash-vs-dataprepper
        insecure: true
You can find a docker-compose working example <<here>>. Unzip the file and run:
docker-compose up
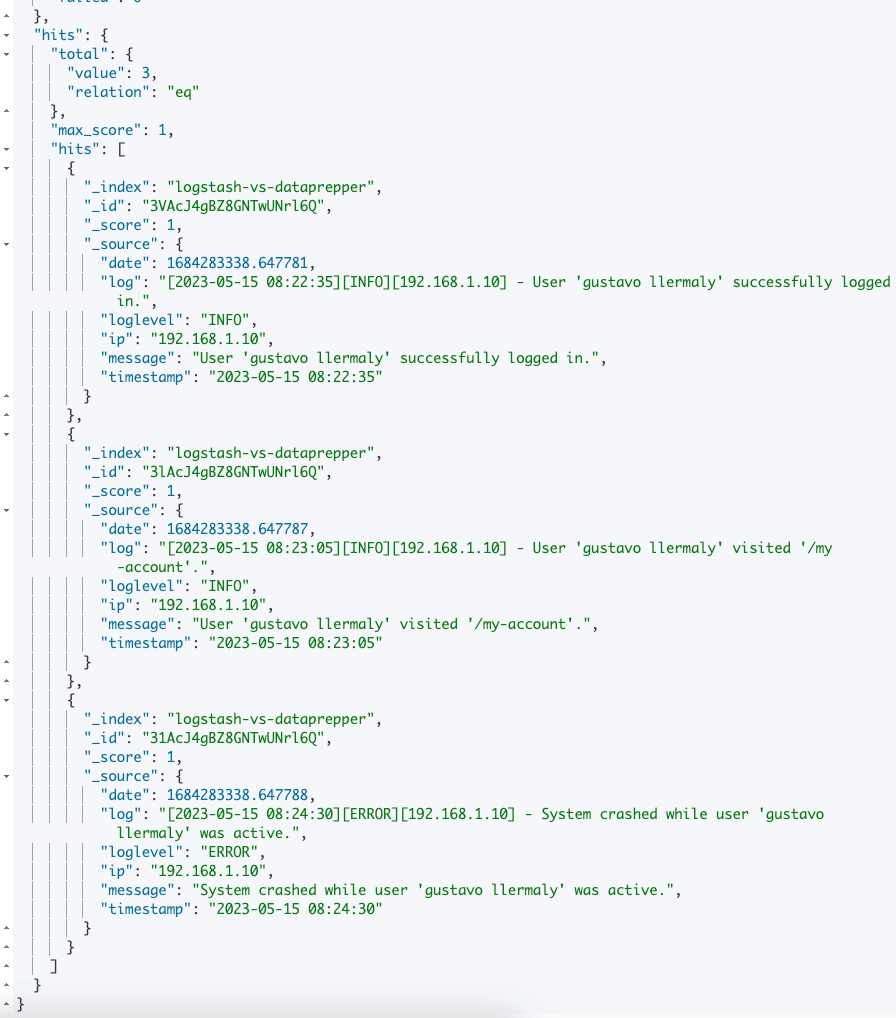
Then go to https://localhost:5601 (user: admin, password: admin) to see the logs in the OpenSearch Dashboards:
Conclusion
In one sense, it is not fair to compare Data Prepper with Logstash as the latter has an almost ten-year advantage. But having said that, both tools can be used for ingestion in a wide variety of use cases.
The main differences between the two are as follows:
- Logstash provides more flexibility, with more plugins and the ability to perform multi-filter inputs and outputs.
- Logstash has more robust dead letter queue and persistent queue systems.
- Data Prepper shows a more clear intention to provide tools for logs and traces.
- Data Prepper includes an anomaly detection processor, and it is tightly integrated with OpenTelemetry to support APM-related scenarios.
- Data Prepper partially supports using Logstash files.
- Data Prepper continues to be developed under an Apache 2.0 open source license, and its development is essentially guaranteed to be compatible with OpenSearch in the future. In contrast, OpenSearch users wishing to retain compatibility cannot use Logstash versions above 7.16.2.
People who are already using Logstash may want to wait for the emergence of more Logstash features on Data Prepper before taking the plunge and converting. However, users who are starting up afresh should certainly consider the merits of Data Prepper since it appears to be the only solution that can guarantee long-term compatibility with OpenSearch.
You can read the documentation about Logstash here:
Logstash – OpenSearch documentation
And you can read more about Logstash’s OpenSearch output plugin official fork here
opensearch-project/logstash-output-opensearch: A Logstash plugin that sends event data to OpenSearch clusters and stores them as an index. (github.com)