This guide covers how to set up monitoring with Prometheus and Grafana. The instructions in this guide pertain to manual processes in Elasticsearch.
Quick links
- What is Prometheus?
- Installing Prometheus
- Installing Prometheus Exporter
- Installing Grafana
- Adding Prometheus as a data source
- Adding recording rules
- Conclusion
Prometheus: Definition
Prometheus is an open-source monitoring tool that integrates with many data sources, offering monitoring, alerting, and visualization capabilities via Grafana integration.
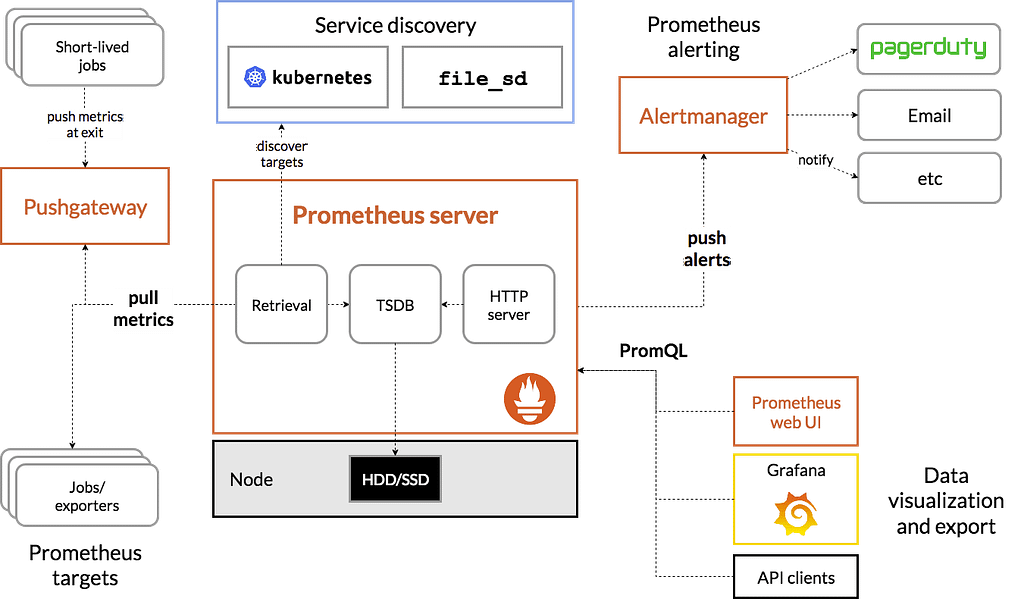
This guide uses Prometheus Elasticsearch Exporter and Grafana for the visualizations.
For this process users will need:
- A machine that’s compatible with Elasticsearch exporter
- A running Elasticsearch instance
Once a compatible exporter is downloaded, start Elasticsearch, and proceed to install the remaining assets.
Installing Prometheus
There are many methods to install Prometheus, this guide will stick to the binary approach.
After downloading the binary, extract it and navigate to the folder. Open “prometheus.yml” and add the following:
global:
  scrape_interval: 15s

scrape_configs:
- job_name: elasticsearch
  static_configs:
  - targets: ['localhost:9114']
After installing the Exporter, outlined in the next step, users can start Prometheus using the following command:
./prometheus –config.file=./prometheus.yml
Installing Prometheus Exporter
The Exporter will pull metrics from Elasticsearch and generate a HTTP endpoint that Prometheus can crawl from.
Download the exporter here, extract the exporter, decompress, and run the following from the extracted folder:
./elasticsearch_exporter --es.uri="http://localhost:9200"
An output like this should be visible:

Test the endpoint by running:
curl http://localhost:9114/metrics
An output like the one below indicates Exporter is ready for Prometheus to crawl.

Installing Grafana
Follow system instructions.
For macOS:
curl -O https://dl.grafana.com/enterprise/release/grafana-enterprise-9.2.0-beta1.darwin-amd64.tar.gz
Decompress
tar -xvf grafana-enterprise-9.2.0-beta1.darwin-amd64.tar.gz
cd to the folder
cd grafana-9.2.0-beta1
and run:
./bin/grafana-server web
Now go to localhost:3000 and login using admin:admin credentials, users should see the following:

Adding Prometheus as a data source
Go to http://localhost:3000/datasources/new to add a new prometheus Data Source
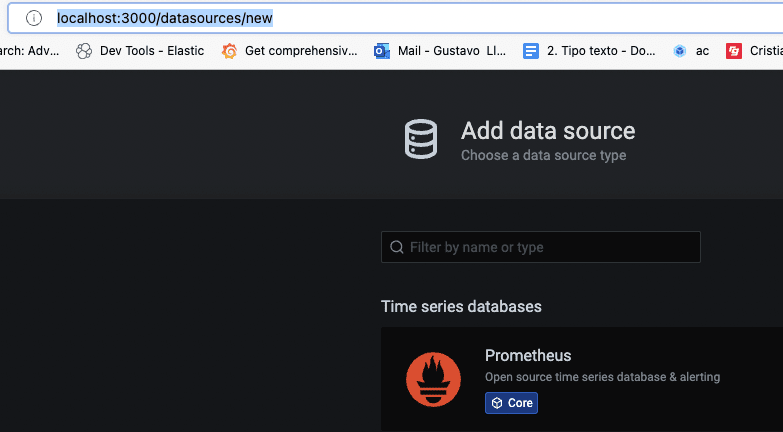
Set http://localhost:9090/ as the URL, and click Save & Test.
Importing the Dashboard
View the Dashboard description here: Elasticsearch Exporter | Grafana Labs
Go to: http://localhost:3000/dashboard/import and enter 14191 as the Dashboard ID, and click Load.
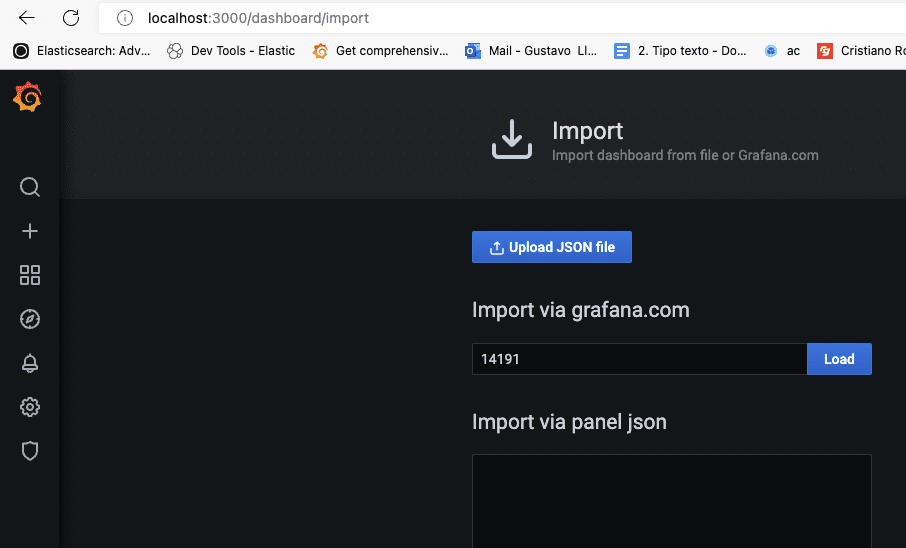
Now go to http://localhost:3000/dashboards and select: Elasticsearch Exporter Quickstart and Dashboard.
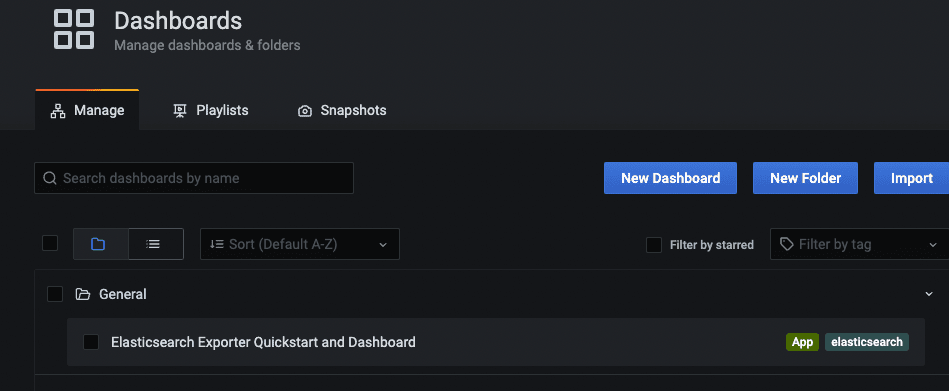

Done! Now users can monitor their Elasticsearch instance using Prometheus and Grafana.
Adding recording rules
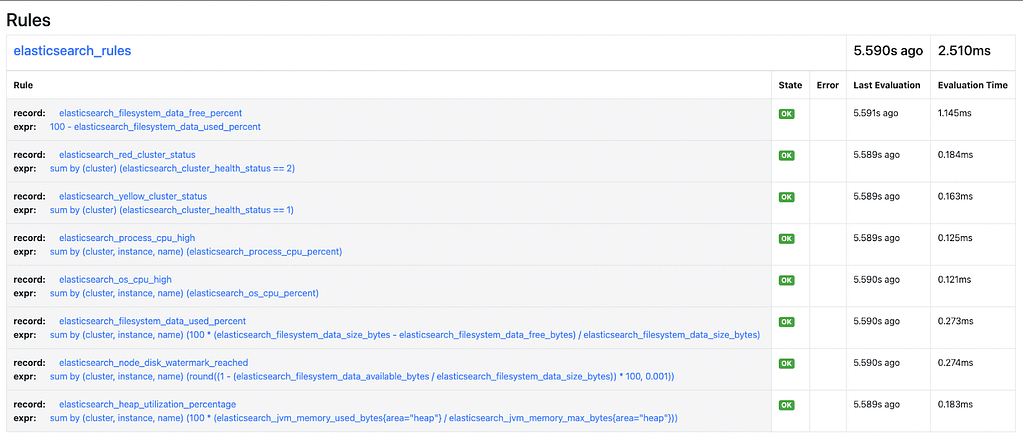
Some visualizations require configuring Recording Rules. Recording rules allow users to precompute frequently needed or computationally expensive expressions, saving their result as a new set of time series. This allows the dashboard to query against the precomputed values, which is more performant.
To add recording rules, download this file, save it in the Prometheus folder, and add the following the prometheus.yml:
rule_files:
 - "elasticsearch_exporter_alerting_rules.yml"
Where elasticsearch_exporter_alerting_rules.yml is the path to the file downloaded in the previous step.
Now restart Prometheus.
Confirm these were added by visiting http://localhost:9090/rules.
Conclusion
Setting up a monitoring stack with Prometheus and Grafana is a simple task using Elasticsearch Exporter for Prometheus. This builds the data metrics format for all users.


