Quick Links
Introduction
This quick guide will show you how to enable resource usage alerts in your Elastic Cloud deployment and receive an operational email when a CPU, memory, or disk usage threshold is crossed or when errors and exceptions occur.
Quick recipe
To set up operational alerting for your Elastic Cloud deployments, all you need to do is simply follow the steps below.
Step 1
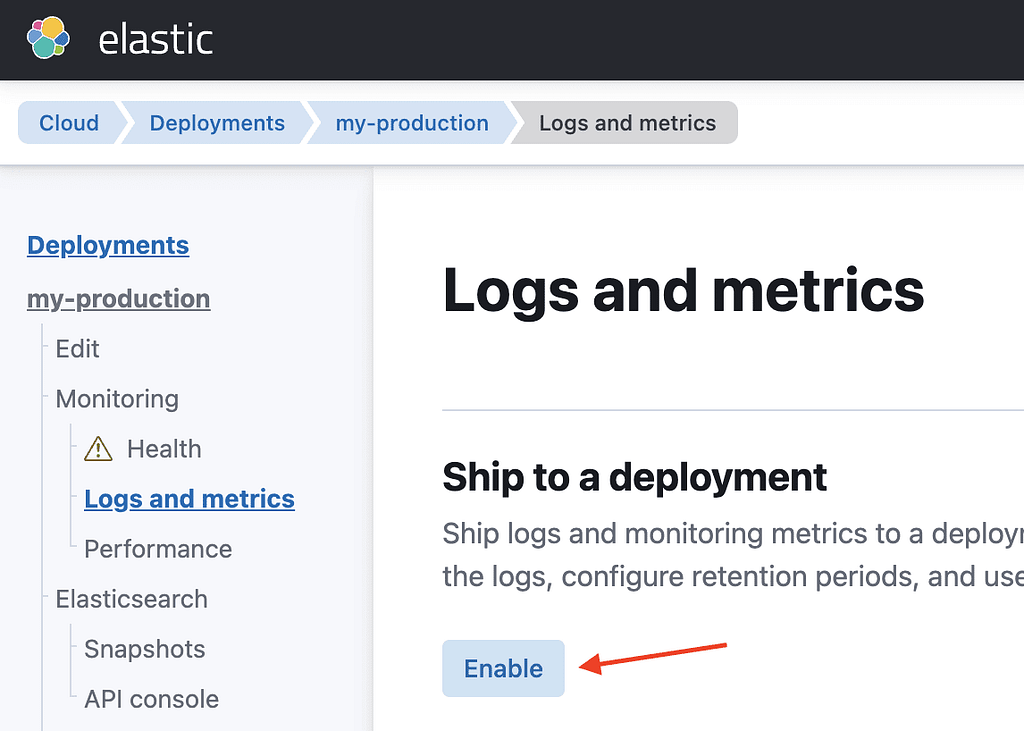
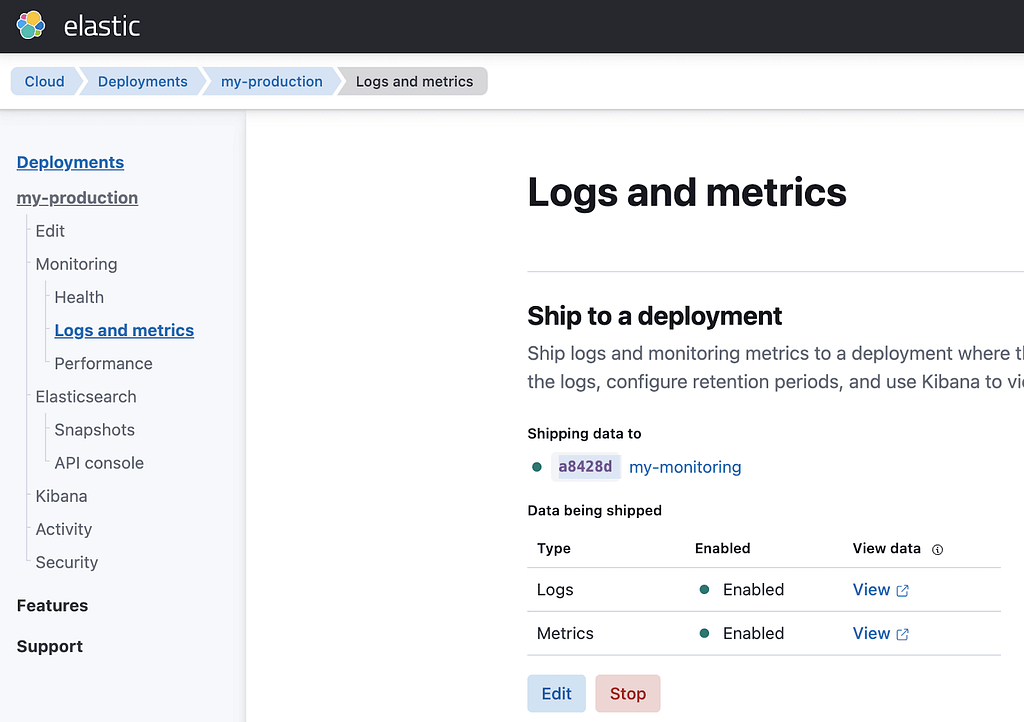
In your Elastic Cloud console, go to “Deployment > Monitoring > Logs and metrics” and enable logging and metrics. It is recommended to ship the logs and monitoring metrics data to a different deployment than your production cluster, but you don’t have to do that for these alerts to work. Figures 1 and 2, below, show how to enable logs and metrics and how to ship them to a monitoring cluster, respectively.
Figure 1: Enable logs and metrics

Figure 2: Shipping logs and metrics to a monitoring cluster

Step 2
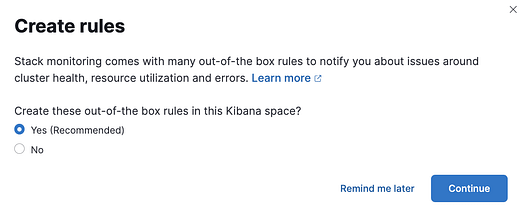
Next, go to Stack Monitoring in the left menu and enable the creation of the default alerting rules. The first time you navigate to Stack Monitoring, you will be asked whether you want to create the default alerting rules or not. It is recommended to do so, but if you prefer to create your own rules, you can do that instead, as shown in Figure 3, below.
Figure 3: Enable default alerting rules creation

Step 3
After enabling the creation of the rules, the next step is to click on the “Enter setup mode” button at the top right of the screen, as shown in Figure 4, below.
Figure 4: Entering setup mode

Step 4
Once the setup mode has been enabled, you can see that different rules have been pre-defined in different locations, as shown in Figure 5, below.
Figure 5: Alerting rules have been pre-defined

Step 5
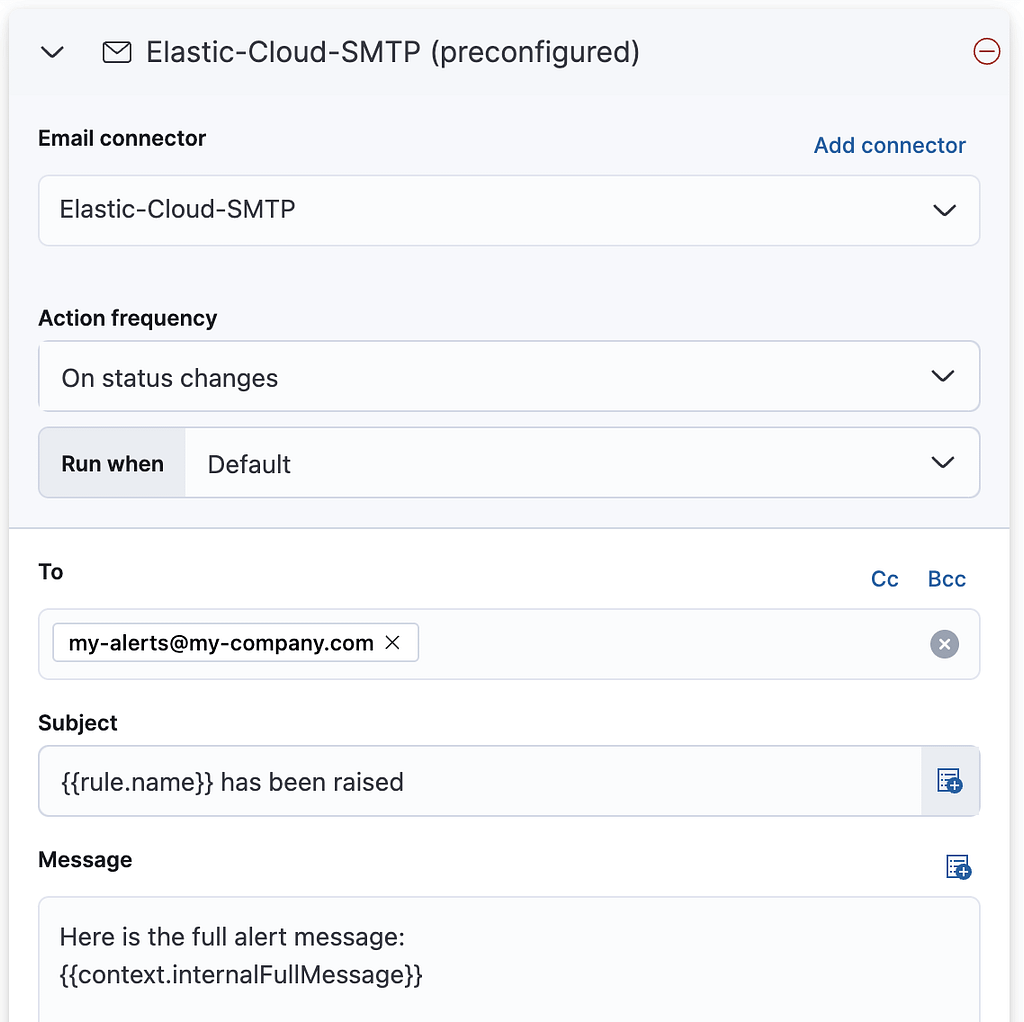
You can click on each rule and adapt it to your own needs by modifying the pre-configured thresholds and many other settings. In the Actions section of the rules edition panel, you can choose the pre-configured Elastic-Cloud-SMTP email connector in order to send your alerting emails, as shown in Figure 6, below. That’s it, you’re all set!
Figure 6: Edit rule and configure email connector

Final notes
If all you want is to get notified when your disk usage crosses a certain threshold, you don’t need to do anything as an operational email will automatically be sent to all operational users configured for your organization when your disk usage crosses the 90% threshold during 15 minutes. An automatic email also gets sent when a node restarts due to an out-of-memory failure.


