
Quick links
Introduction
This quick guide will show you how to leverage Logstash to aggregate multiple events that share some common data. The most common use case for this is when you are retrieving data from a relational database and your SQL query joins a few tables together. It can also be useful when you’re reading some newline delimited JSON file or receiving data through a socket, but it doesn’t really matter where the data comes from as you’ll see shortly.
The context
Let’s say your source of truth is a relational database and you want to leverage Elasticsearch to provide advanced search features on top of your data to your users. Your SQL query might look something like this:
SELECT p.id as product_id, p.name, p.price, p.category, a.key, a.value
FROM product p
LEFT JOIN attributes a ON a.product_id = p.id
SORT BY p.id ASC
When running it, you get columnar data that would look like this:
| Product ID | Name | Price | Category | Attr. key | Attr. value |
|---|---|---|---|---|---|
| 1 | Product 1 | 10.45 | Toy | size | 1 |
| 1 | Product 1 | 10.45 | Toy | size | 2 |
| 1 | Product 1 | 10.45 | Toy | color | brown |
| 1 | Product 1 | 10.45 | Toy | color | red |
| 2 | Product 2 | 3.75 | Apparel | size | 3 |
| … | … | … | … | … | ... |
As you can see, the first four columns contain the same values (from the product table), while the last two contain different ones since they represent different attribute values for the same product. Your ultimate goal is to index the following JSON document in your Elasticsearch engine, where the `attributes` array is of type `nested` because you will need to run multiple conditions to find your products (e.g., size = 1 and color = red):
{
  "id": 1,
  "name": "Product 1",
  "category": "Toy",
  "price": 10.75,
  "attributes": [
    {
      "key": "size",
      "value": 1
    },
    {
      "key": "size",
      "value": 2
    },
    {
      "key": "color",
      "value": "brown"
    },
    {
      "key": "color",
      "value": "red"
    }
  ]
}
The first logical choice is to leverage Logstash’s `jdbc` input plugin to run that SQL query. The `jdbc` plugin will retrieve your data row by row, and then you will need to reconstruct it within Logstash. For example, to build the above document for Product 1 with four attributes, Logstash will need to process four different events coming in the input pipeline and only produce a single event in the output pipeline. Such a feat can be achieved with the `aggregate` filter plugin that we are going to present next.
Different ways to aggregate
When you need to process several separate events that share some relationship and aggregate them into a single event, you have to be able to detect when to start and when to stop aggregating them. As can be seen in Figure 1, below, sometimes you have a way to detect when a sequence begins and when it ends, sometimes you only know when it ends, and sometimes you have no indication at all. In the latter case, it is helpful if the events are at least sorted by the property that you will aggregate on, e.g., a product ID.
Figure 1: Different sequences of events
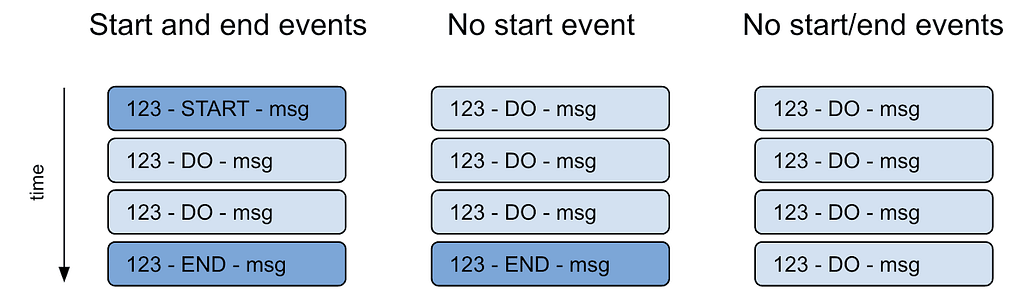
In our case, we don’t have any start or end event to detect when to start or stop aggregating a product. However, as can be seen in our SQL query, we know that all our events will be sorted by product. That allows us to aggregate on the product ID, and as soon as a new product ID comes up, we know that we can wrap up the previous one and send it over for further processing.
Let’s dive in
The `aggregate` filter plugin provides support for processing and accumulating each event into an in-memory map and, at some point, deciding when that map should be “released” as a new aggregated event. In terms of code, it looks like this:
 filter {
     aggregate {
       task_id => "%{product_id}"
       code => "
         map['product_id'] ||= event.get('product_id')
         map['name'] ||= event.get('name')
         map['category'] ||= event.get('category')
         map['price'] ||= event.get('price')
         map['attributes'] ||= []
         map['attributes'] << {'key' => event.get('key'), value' => event.get(value')}
         event.cancel()
       "
       push_previous_map_as_event => true
       timeout => 3
     }
   }
Let’s now go through what this code does. On line 3, we declare that we are aggregating on the `product_id` field, so a new temporary in-memory map is created every time a new `product_id` is detected. On lines 5 through 8, we are simply storing the four product fields in our map, and on line 9, we are creating an empty `attributes` array to store all attribute key/value pairs. On line 10, we are adding each attribute key/value pair to the `attributes` array, and on line 11, we are canceling the current event so it doesn’t get any further in the Logstash processing pipeline.
Finally, on line 13, we set `push_previous_map_as_event` to true so that the in-memory map containing the complete aggregation of the current product will be pushed as a new event into the Logstash pipeline as soon as a new `product_id` is detected.
Figure 2, below, summarizes the full process; the data in bold is the data that is aggregated at each step.
Figure 2: Event aggregation process

That’s it, there’s nothing more to it, we received four events from the `jdbc` input but only produced a single aggregated document in the `elasticsearch` output.
Full example
You can find the complete Logstash configuration below if you want to try it on your data:
input {
    jdbc {
        jdbc_driver_library => "/usr/share/java/mysql-connector-j-8.1.0.jar"
        jdbc_driver_class => "com.mysql.jdbc.Driver"
        jdbc_connection_string => "jdbc:mysql://127.0.0.1:3306/database_name"
        jdbc_user => "username"
        jdbc_password => "password"
        statement => "SELECT p.id as product_id, p.name, p.price, p.category, a.key, a.value FROM product p LEFT JOIN attributes a ON a.product_id = p.id SORT BY p.id ASC"
    }
}
filter {
  aggregate {
    task_id => "%{product_id}"
    code => "
      map['product_id'] ||= event.get('product_id')
      map['name'] ||= event.get('name')
      map['category'] ||= event.get('category')
      map['price'] ||= event.get('price')
      map['attributes'] ||= []
      map['attributes'] << {'key' => event.get('key'), value' => event.get(value')}
      event.cancel()
    "
    push_previous_map_as_event => true
    timeout => 3
  }
}
output {
    elasticsearch {
        hosts => "localhost:9200"
        index => "my-products"
        document_id => "%{product_id}"
    }
}
Final notes
The Logstash `aggregate` filter plugin is very powerful, and we have only shown some of its capabilities. Make sure to check out the official documentation of the plugin to see what else it can do.
One last important thing worth noting is that if you run on several CPUs, you MUST run Logstash with a single worker (i.e., with `-w 1`) otherwise your events will be dispatched among several threaded pipelines and won’t be aggregated the way you expect. I filed a feature request on this issue a long time ago, but unfortunately, it never got any traction.