
Quick Links
Introduction
Odds are you’ve come across the official and famous Elasticsearch tagline (i.e. “You Know, for Search”) at least once since you started playing with Elasticsearch. That tagline dates as far back as when Elasticsearch almost exclusively focused on searches and didn’t provide much support for aggregations, which by the way were called facets.
The 1.0 release saw facets renamed to aggregations, and more importantly, made it possible to nest them at any arbitrary level, enabling endless analytics possibilities and a myriad of new ways to slice and dice data. In fact, had the tagline been changed to “You Know, for Search and Analytics,” it wouldn’t have been shocking to anyone.
The new incarnation of aggregations were here to stay, and from then on, they have gotten more and more powerful with each new release. They enabled all sorts of new analytics use cases, but like usual when the sky’s the limit, some of these weren’t supported by existing aggregations.
Enter `scripted_metric,` which was released in 1.4.0, basically enabled users to write their own bespoke aggregation logic. Interesting, right? Well, buckle up, that’s what we’re going to cover in this short guide.
What Does It Look Like?
There are three different types of aggregations:
- Bucketing aggregations whose job is to group documents within specific buckets, e.g. by term, by date range, etc.
- Metric aggregations that compute some metric value over all documents in a given bucket, e.g. minimum or maximum value of a specific field, cardinality of a given field, etc.
- Pipeline aggregations that work on the output of the other two aggregation types, i.e not directly on the documents themselves.
Unsurprisingly, the `scripted_metric` aggregation falls into the second category. Its main goal is to produce one or several metric values.
At a high level, the aggregation looks something like this:
POST index/_search
{
  "size": 0,
  "query": {
    "match_all": {}
  },
  "aggs": {
    "my_metric": {
      "scripted_metric": {
        "init_script": "...",
        "map_script": "...",
        "combine_script": "...",
        "reduce_script": "..."
      }
    }
  }
}
In the code above, we can see the specification of a scripted metric aggregation called `my_metric` which is defined by four different scripts that allow you to write your own aggregation logic using the Painless scripting language.
You might be wondering why we need four different scripts. Looking at their names might give off a few hints.
If MapReduce doesn’t ring any bells, just remember that it is a very popular programming model popularized by Google that aims to provide support for processing very large amounts of data in a parallelized and distributed fashion. Since Elasticsearch is distributed by design, it makes sense to leverage MapReduce in order to perform computations over large amounts of documents spread over different shards hosted on different nodes of your cluster.
How Does It Work?
Before getting into too much detail on what each of the scripts does, we need to explain when and where they execute. It might look daunting at first, but it’s actually pretty simple, so don’t be scared:
- `init_script` is executed once on each shard at the very beginning of the process to initialize the state.
- `map_script` will run once for each document selected by the query on each shard of your index.
- `combine_script` will be executed once on each shard after `map_script` has run over all the documents selected on the shard. The goal of this script is to summarize each of the per-document values produced by `map_script` into a single value for the whole shard.
- `reduce_script` will be executed once on the coordinator node after receiving all shard-specific values produced by `combined_script.`
Figure 1, below, illustrates the process of running the scripted metric aggregation on an index with three shards. The query selects three documents on each shard and the scripted metric aggregation computes the total sum of all price values contained in the documents. This is exactly what the built-in `sum` metric aggregation already does, but this helps illustrate the process.
Figure 1: Running a scripted metric aggregation on an index with three shards
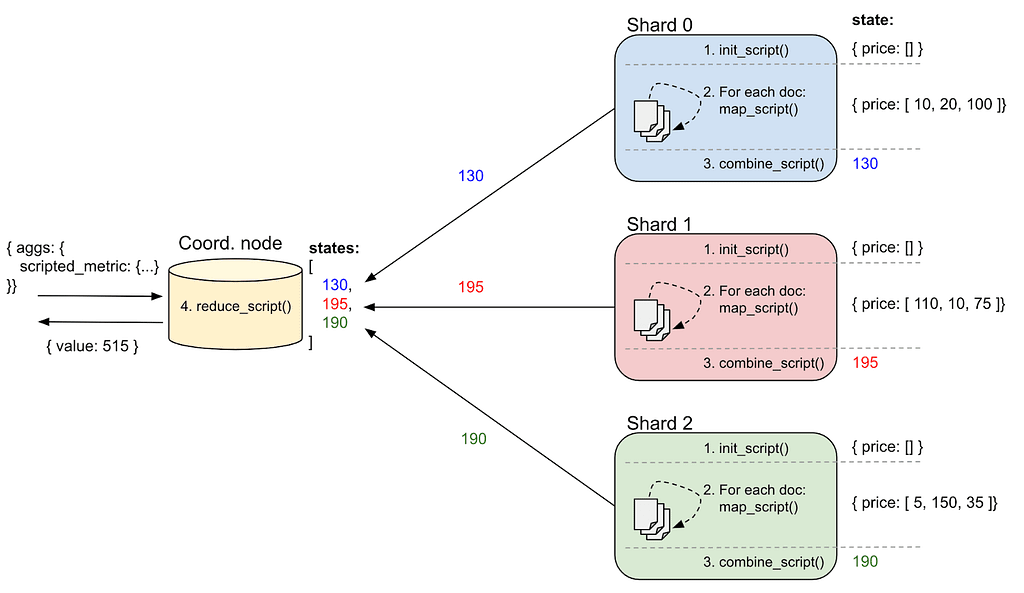
On each shard, a local `state` variable is passed to `init_script` which creates an empty price array. Then, we iterate over the selected documents and `map_script` is called for each of them in turn. `map_script` adds the value of the `price` field of the current document to the `state.price` array. After all documents have been visited, `combine_script` will simply compute the sum of all the prices in the array and return it to the coordinating node. Finally, `reduce_script` runs on the coordinating node and iterates over all shard states (i.e., an array containing all combined values returned by each shard), sums them up, and returns the total sum of all shard sums.
The `state` map is shared with the init, map, and combine scripts. The former two do not return anything but are free to modify the shared state at will. The combine script can use the shared map to produce a single return value, that can be of any of the following four types:
- any primitive type (integer, double, etc)
- a String
- a Map containing keys and values of any of these four types
- an Array containing values of any of these four types
In terms of implementation logic, the aggregation code of each script would look like this:
POST index/_search
{
  "size": 0,
  "query": {
    "match_all": {}
  },
  "aggs": {
    "my_metric": {
      "scripted_metric": {
        "init_script": "state.price = []",
        "map_script": "state.price.add(doc.price.value)",
        "combine_script": "state.price.stream().mapToInt(Integer::intValue).sum()",
        "reduce_script": "states.stream().mapToInt(Integer::intValue).sum()"
      }
    }
  }
}
The response from running this scripted metric aggregation would look like this:
{
  "took" : 21,
  …
  "aggregations" : {
    "my_metric" : {
      "value" : 515
    }
  }
}
As you can see, the scripted metric aggregation returns a single metric value, which is the sum of all price values in our documents.
A word of Caution
Even though it might seem tempting to go ahead and write your own aggregation logic, be aware that the scripted metric aggregation relies heavily on scripting, which is a widely known performance killer. You should make sure to use this aggregation sparingly and to test it extensively on non-production clusters first.
Pay special attention when running a scripted metric aggregation on a high volume of documents, as it can hog heap memory pretty badly.
The scripted metric aggregation is a shortcut for quickly prototyping custom aggregation logic, but once you nail it, you should consider implementing a Java plugin for your new aggregation, as it’s much more performant and optimal.
Conclusion
We have seen how to implement or prototype your own aggregation logic using the scripted metric aggregation that was released in ES 1.4.0. Keep in mind that aggregation is composed of four different Painless scripts that run at different moments in the process and at different locations in your cluster.
Finally, be aware of the performance implications of using the scripted metric aggregation in production, and create a custom Java plugin instead.